Debugging external python library in VS Code
Sometimes we would like to know how an external library works, or the documentation is not sufficient to understand its behavior. “The code should be self-explanatory” - let’s take advantage of it.
The case is as following - I wanted to use pre-commit and one of its features is excluding certain files or folders from linting. I would like to make use of it - specify a list of folders to exclude in nice, multi-line human-readable format. Unfortunately, the documentation was vague about how it should be formatted exactly. At this point, my experiments failed. How could I know the proper format?
Debugging and actual code to the rescue 🚀
Fortunately, I found that under the hood, the value of exclude: is treated as string and feed into re.compile and
re.search python function. Debugging its internals helped me to understand how it works, and made it work.
Debugging external library
Prerequisities
First of all, I use venv (python -m venv venv), so the system is not bloated. After setting the environment, the
packages are installed as usual, using pip.
The setup consists of:
- the editor - VS Code
- debug link - debugpy
- the package itself - in my example it is
pre-commit
Setting up
Two stage setup:
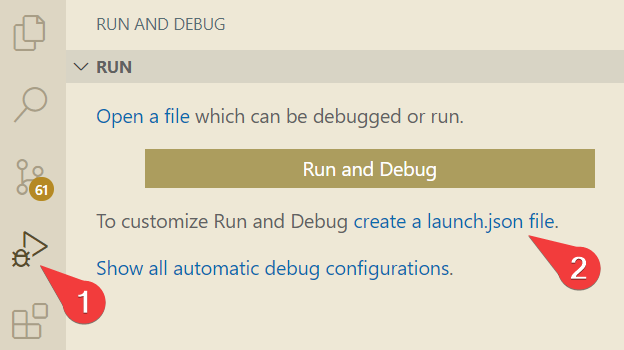
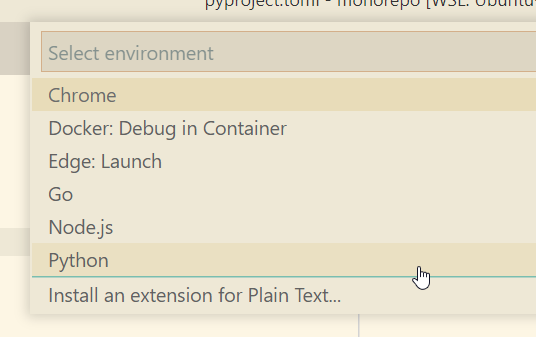
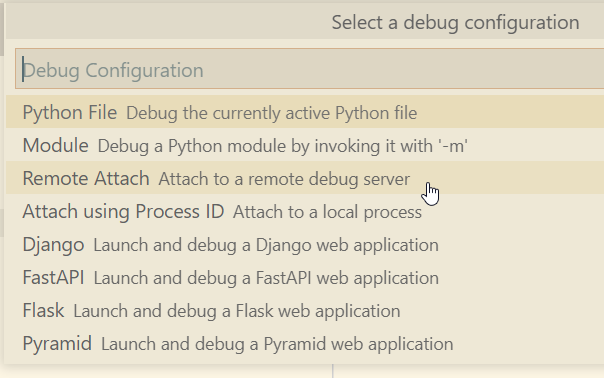
VS Code configuration for debugging


The most important step afterwards - set
justMyCodetofalse:
Running the subject with debugger attached
Open console, use your venv, and run the code:
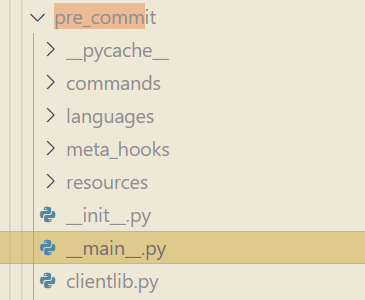
(venv) λ python -m debugpy --listen 0.0.0.0:5678 --wait-for-client -m pre_commit run --all-filesThe debugger is waiting for attach. What’s left is finding your library entrypoint, setting a breakpoint, and starting debugging.
